Predicting rain with Scikit (Machine Learning)
In the olden days of yore, predicting the weather was near-impossible task reserved to fortunetellers and shamanistic figures. People would spend their lives, rather unfruitfully, trying to unlock just a small glimpse into the future.
Lucky for us then that we live in the future. So here’s how to do it in five minutes.
Let’s choose a simple task, like predicting if it will be rainy in Seattle on a given day in the future. The benefit of this is that as the cloudiest city in America, our algorithm doesn’t have to be much more accurate than a coin flip.
I’m using this data set that catalogs historical days of rain in the area from 1948-2017. Our data contains 5 dimensions:
DATE = the date of the observation
PRCP = the amount of precipitation, in inches
TMAX = the maximum temperature for that day, in degrees Fahrenheit
TMIN = the minimum temperature for that day, in degrees Fahrenheit
RAIN = True if rain was observed on that day, False if it was not
So one line of input might look something like
"19950909",0,76,54,"FALSE",
which would mean
September 9th 1995, high of 76, low of 54, 0 inches precipitation, so no rain.
To start, we’ll bring in three python libraries, the real heavy hitters.
 import numpy
 import pandas
 import sklearn
Numpy gives us a bunch of ways to manipulate numbers (such as square-root functions), pandas let’s us work with datasets to create tables and whatnot, and sklearn (short for SciKit-Learn) brings the machine learning algorithms that make this possible.
Now let’s bring in our dataset and take a look at it.
weather = pandas.read_csv("C:/Users/Samue/Desktop/MyWebsite/CloudsML/seattleWeather_1948-2017Copy.csv", header = 0, sep = ",")
#We can specify headers manually by adding `names=["DATE", "PRCP", "TMAX", "TMIN", "RAIN"]` to above.
#Since the first line of our data contains the headers, we'll let pandas take care of it automatically with the headers = 0 parameter.
>>> print(weather.head())

     DATE  PRCP  TMAX  TMIN  RAIN
0  19480101  0.47    51    42  True
1  19480102  0.59    45    36  True
2  19480103  0.42    45    35  True
3  19480104  0.31    45    34  True
4  19480105  0.17    45    32  True
>>> print(weather.describe())

       DATE          PRCP          TMAX          TMIN
count  2.555100e+04  25548.000000  25551.000000  25551.000000
mean   1.982543e+07      0.106222     59.544206     44.514226
std    2.019306e+05      0.239031     12.772984      8.892836
min    1.948010e+07      0.000000      4.000000      0.000000
25%    1.965063e+07      0.000000     50.000000     38.000000
50%    1.982122e+07      0.000000     58.000000     45.000000
75%    2.000062e+07      0.100000     69.000000     52.000000
max    2.017121e+07      5.020000    103.000000     71.000000
That’s some mighty-fine looking data.
Before we start, let’s do some basic data cleaning. Do we have any N/A values that will mess with our data?
>>> print(weather.isnull().values.any())
True
Yep, looks like we have a few days without rain data, such as "19980602","NA",72,52,"NA".
We can get fancy and predict precipitation values through a nearest-neighbors check, but let’s just remove them as it only accounts for a loss of ~5 rows.
weather = weather.dropna()
We’re going to predict how much it will rain on a day (predict the PRCP value). We’ll split our data into two sets, X (the independent data), and Y (the dependent data we want to predict).
X = weather.drop(["PRCP", "RAIN"], axis=1) #all columns except PRCP and RAIN, as both give the answer away.
y = weather["PRCP"]
great, now we have an array containing just our date and temperature values, and an array with just the precipitation values. Our goal is to predict the y on a date when given X.
Using the train_test_split function, we create the appropriate training/testing data for our features (“X_train” and “X_test” respectively) and target data (“y_train” and “y_test”). We are specifying our test data to be 20% of the total data (80/20 split model, thanks Pareto). We are also providing a defined seed value (42) to be able to reproduce this split if we want to come back to it later. Without a defined seed, it will split the data differently each time we run it, making debugging a bit more difficult.
 X_train, X_test, y_train, y_test = train_test_split(X, y, test_size=0.2, random_state=42)

>>> print(X_train.shape)
(20438, 3) #20438 training rows
>>> print(X_test.shape)
(5110, 3) #5110 testing rows
Now it’s time to pick a model. Different regression models will fit better for different types of data.
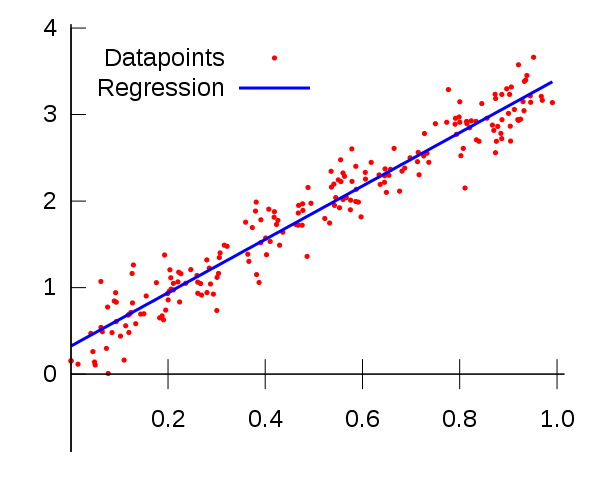
“Linear regression” is the one that get’s all the press, and for good reason - it’s simple and it works well when you have linear data. When you’re trying to predict the price of a house, which seems like something that would scale linearly with input values like square footage, this is a good model to use.
But weather isn’t linear, it’s more of a sin-wave - with temperature peaks and valleys in summer and winter respectively.
While we’re trying to predict rain and not heat, we could make an educated guess that the clouds would follow the seasons to some degree. Sunny summers and cloudy winters.
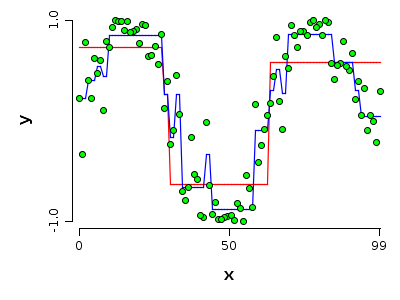
A decision tree model seems like the best fit here.
For fun, let’s also bring in a random forest model. This is a model that builds many individual decision trees, then pools their predictions. It’s in a class of slightly more sophisticated models that are referred to as ‘Ensemble learning’.
Now let’s train these machines!
 from sklearn.tree import DecisionTreeRegressor
 from sklearn.ensemble import RandomForestRegressor

 tree_model = DecisionTreeRegressor()
 rf_model = RandomForestRegressor()

 tree_model.fit(X_train, y_train)
 rf_model.fit(X_train, y_train)
Well that was easy, wasn’t it?
Now that our models are built & trained on the data (we have a comparatively small data set for ML standards, so it goes fast), it’s time to evaluate how well they did.
 def display_scores(scores):
     print("Scores:", scores)
     print("Mean:", scores.mean())
     print("Standard deviation:", scores.std())
     print("\n")


 from sklearn.model_selection import cross_val_score

 scores = cross_val_score(tree_model, X_train, y_train, scoring="neg_mean_squared_error", cv=10)
 tree_rmse_scores = numpy.sqrt(-scores)

 scores = cross_val_score(rf_model, X_train, y_train, scoring="neg_mean_squared_error", cv=10)
 rf_rmse_scores = numpy.sqrt(-scores)
Let’s see how our decision tree model preformed vs our random forest
>>> display_scores(tree_rmse_scores)
Scores: [0.32785747 0.3120757  0.31520675 0.3118263  0.28814834 0.31632178
 0.31382765 0.32981789 0.30310489 0.31043535]
Mean: 0.31286221219866617
Standard deviation: 0.011154876523176923

>>> display_scores(rf_rmse_scores)
Scores: [0.25463742 0.24316711 0.24797083 0.24010446 0.23350186 0.24951792
 0.24806436 0.23225629 0.23227359 0.25888471]
Mean: 0.24403785441735462
Standard deviation: 0.00893830076030914
After one training session, our single tree is off (on average) by about .3 inches of rainfall, while our forest is doing slightly better at 0.24 inches off. Looks like we’re using the forest.
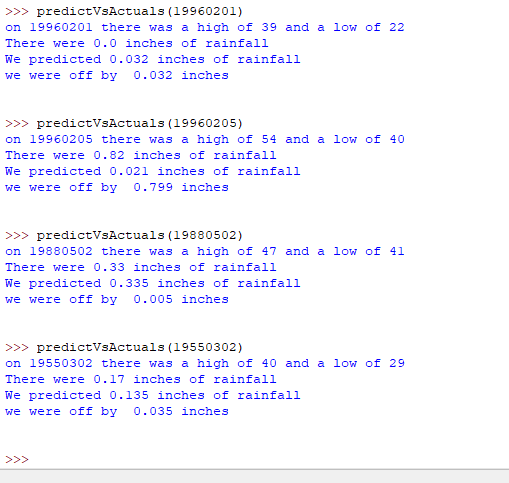
Let’s test this model out. Given just the date, our model will blindly predict how much it thinks it’ll rain. Then, we compare against
 #provide date in form 19480103
 def predictVsActuals(day):
     precipPredictDay = X.loc[X['DATE'] == day]
     precipPredictValue = round(rf_model.predict(precipPredictDay)[0], 3)


     precipActual = weather.loc[wheather['DATE'] == day]
     precipActualValue = round(precipActual.iloc[0]["PRCP"], 3)

     print("On", precipActual.iloc[0]["DATE"], "there was a high of", precipActual.iloc[0]["TMAX"], "and a low of", precipActual.iloc[0]["TMIN"])
     print("There were", precipActualValue, "inches of rainfall")
     print("We predicted",precipPredictValue, "inches of rainfall")
     print("we were off by ", round(abs(precipActualValue-precipPredictValue), 3), "inches")
     print("\n")
Neat!
As you can imagine, there’s a lot more we can do here, but this should give us a good base to go off of to get an initial understanding of ML.
If you’re so inclined, you can check out the code on Github
Todo’s:
- Standardize the data using a scalar, resulting in more efficient training.
- Visualize the data using jupyter notebooks.
- Download data automatically from a weather service, and ambiently train our algorithm (online-learning) to be getting better constantly.